July 27th, 2023
Hello friends of Glean -
We’re switching it up this month and sharing highlights of what our team has built over the last six months, not just in July.
Many of these features were requested or inspired by you! We ❤️ seeing all the ways teams use Glean to build collaborative data cultures at their orgs.
Stay tuned for some major updates coming at the end of the summer…
If you’d like a sneak peek, check out the public roadmap which includes dramatically improved search, joins and more!
- Carlos
New Charts & Visualization Types 😍
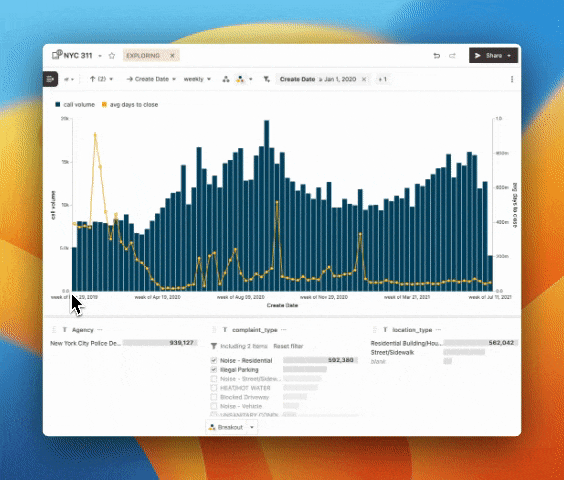
Bar + Line, Multiple Axes, Trellis and More (opens in a new tab) - Choose from bars, areas and lines to layer on top of each other in the same chart. You can also display metrics on different axes and scales, all from the control panel. Explore the data above yourself here!
Transpose Tables (opens in a new tab) - The control panel is full of data viz goodies, including the toggle for transpose tables. Switch the positions of your rows and metrics by switching this on.
Dynamic Breakouts (opens in a new tab) - This upgrade to the breakout feature makes it super easy to always look at the most relevant data. Define criteria that adapts your breakout as your data changes.
Integrations 🖇️
DuckDB (opens in a new tab) - No data warehouse, no problem! Upload json, csv and parquet files into Glean and start visualizing your smaller datasets.
ClickHouse (opens in a new tab) - Another great data source option to connect to Glean when you’re working with larger datasets.
dbt (opens in a new tab) - Build on top of your dbt files and Glean will automatically keep your resources in sync. Make changes to your dbt schema while identifying issues in downstream visualizations and dashboards, sync docs and more!
Collaboration Features 🤝
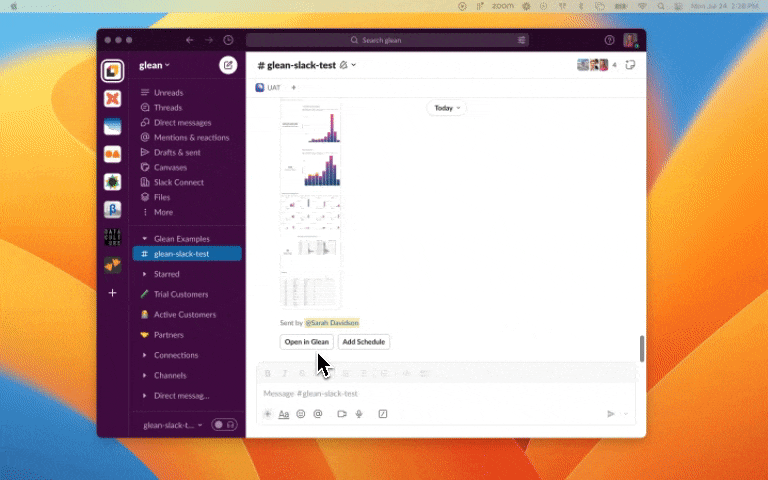
Slack (opens in a new tab) - Schedule automated reports to keep your team up to date and engaged with important metrics. Share saved explorations and dashboards with added notes and context.
Public Links (opens in a new tab) - Showcase and share your data, view-only, with others on the public internet. No authentication required to view saved explorations, dashboards and collections.
Description Syncing (opens in a new tab) - If you’ve already written docs in dbt or directly in your dwh, we’ll take care of the rest! Descriptions will be automatically imported when you create a Data Model, or add new attributes to it.
BI as Code Workflows 👩💻
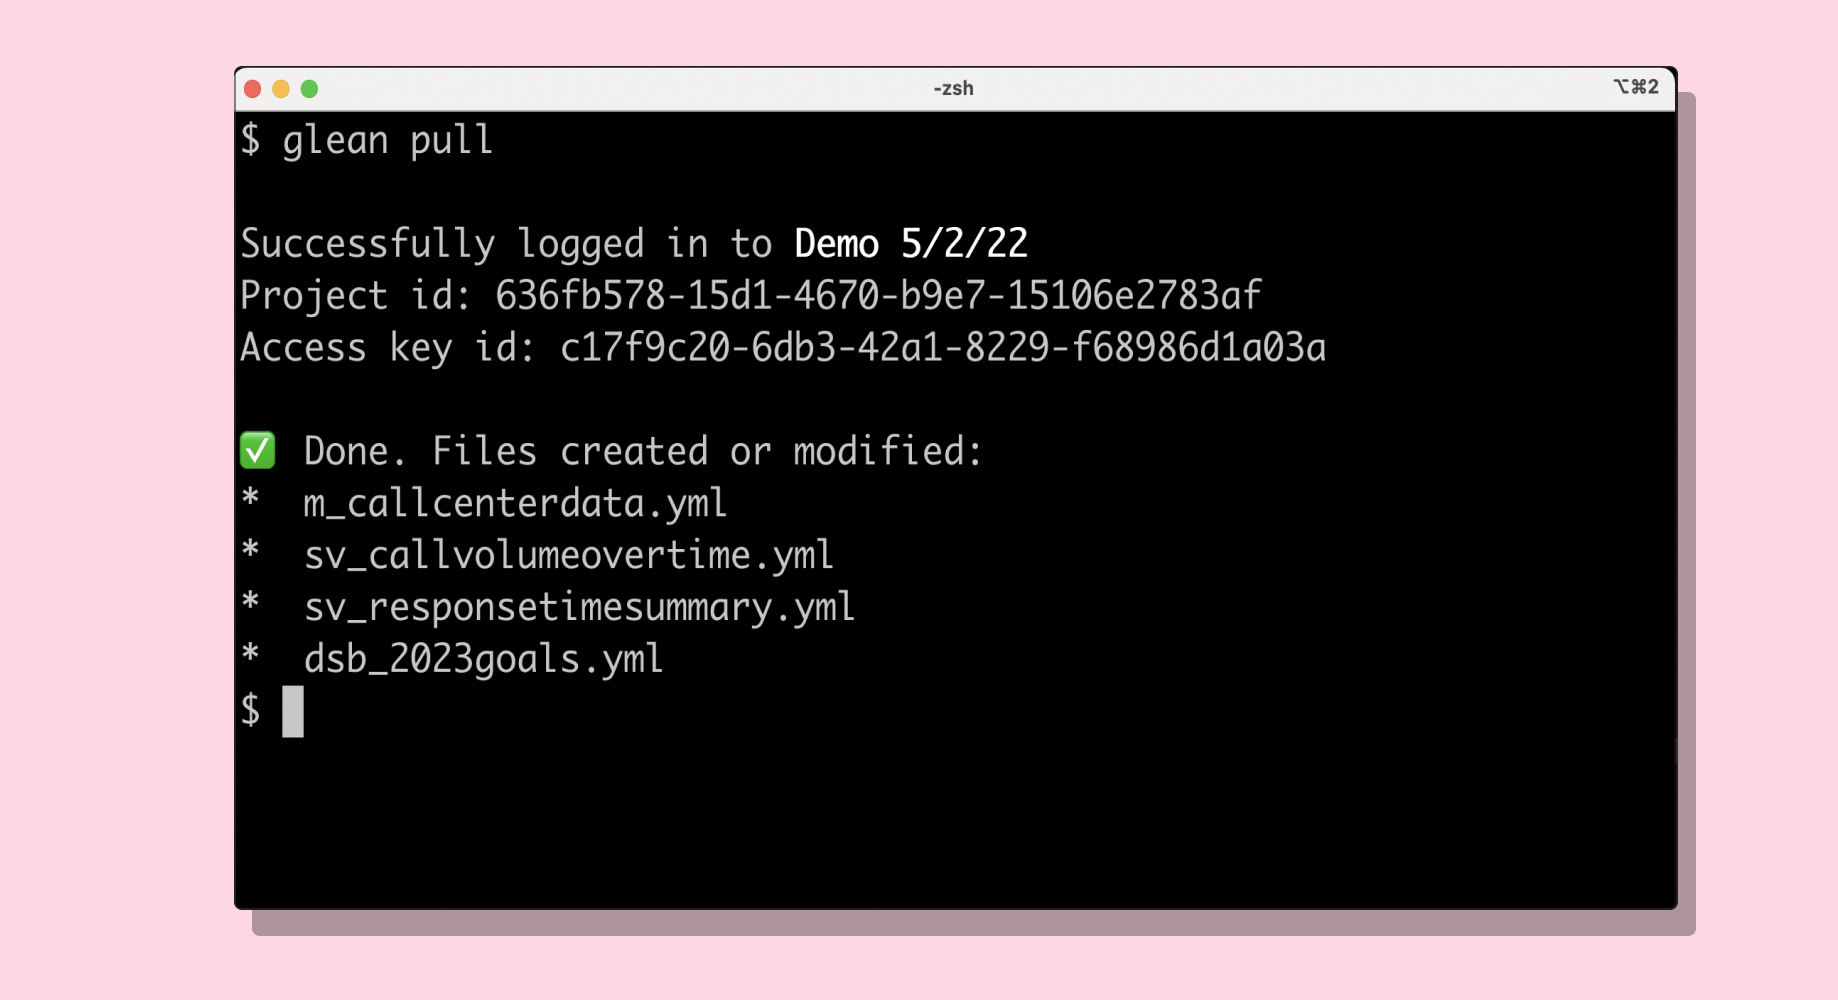
Glean Pull (opens in a new tab) - This command-line utility enables you to create and update DataOps configs from web-based resources. Confidently collaborate with your team in the UI, knowing everything is synced.
YAML Editor (opens in a new tab) - Can you believe this feature has been around less than a year?! Use the editor to iterate on Glean resources as code and see changes in real time.
📚 Other Updates, Blog Posts & More
- BI Tools Comparison - We broke down the good, bad and ugly of BI tools on the blog. Check out (opens in a new tab) where Glean shines compared to legacy tools like Looker and Tableau.
- Row Numbers on Tables - This one is pretty self-explanatory 🙂 every table-based visualization in Glean now has row numbers!
- Pro Tip for Text Datasets - If you’re analyzing datasets containing long blocks of text in Glean, you may have run into limitations. You can now double click on the cells in the underlying data view to see all of the text in a scrollable view.
- Speed Improvements - Exploration interactivity has been improved by ~5x! The data explorer should feel even more clicky now ⚡️
👀 Hoping to see something else on our feature release list? Check out our Product Roadmap and let us know what we’re missing.
You can drop us a note or ping us on Slack with your💡ideas, 🗣 feedback, or 🙋questions. We look forward to👂hearing from you!