March 31st, 2023
Hello friends of Glean -
Happy Spring! We’ve been busy building and releasing new features for you all! Details are below on the latest updates to metric tiles, search in Glean and more.
If you want to catch updates (and memes) more frequently from the Glean team, be sure to follow us on LinkedIn (opens in a new tab) and Twitter (opens in a new tab).
- Carlos
Metric Tiles

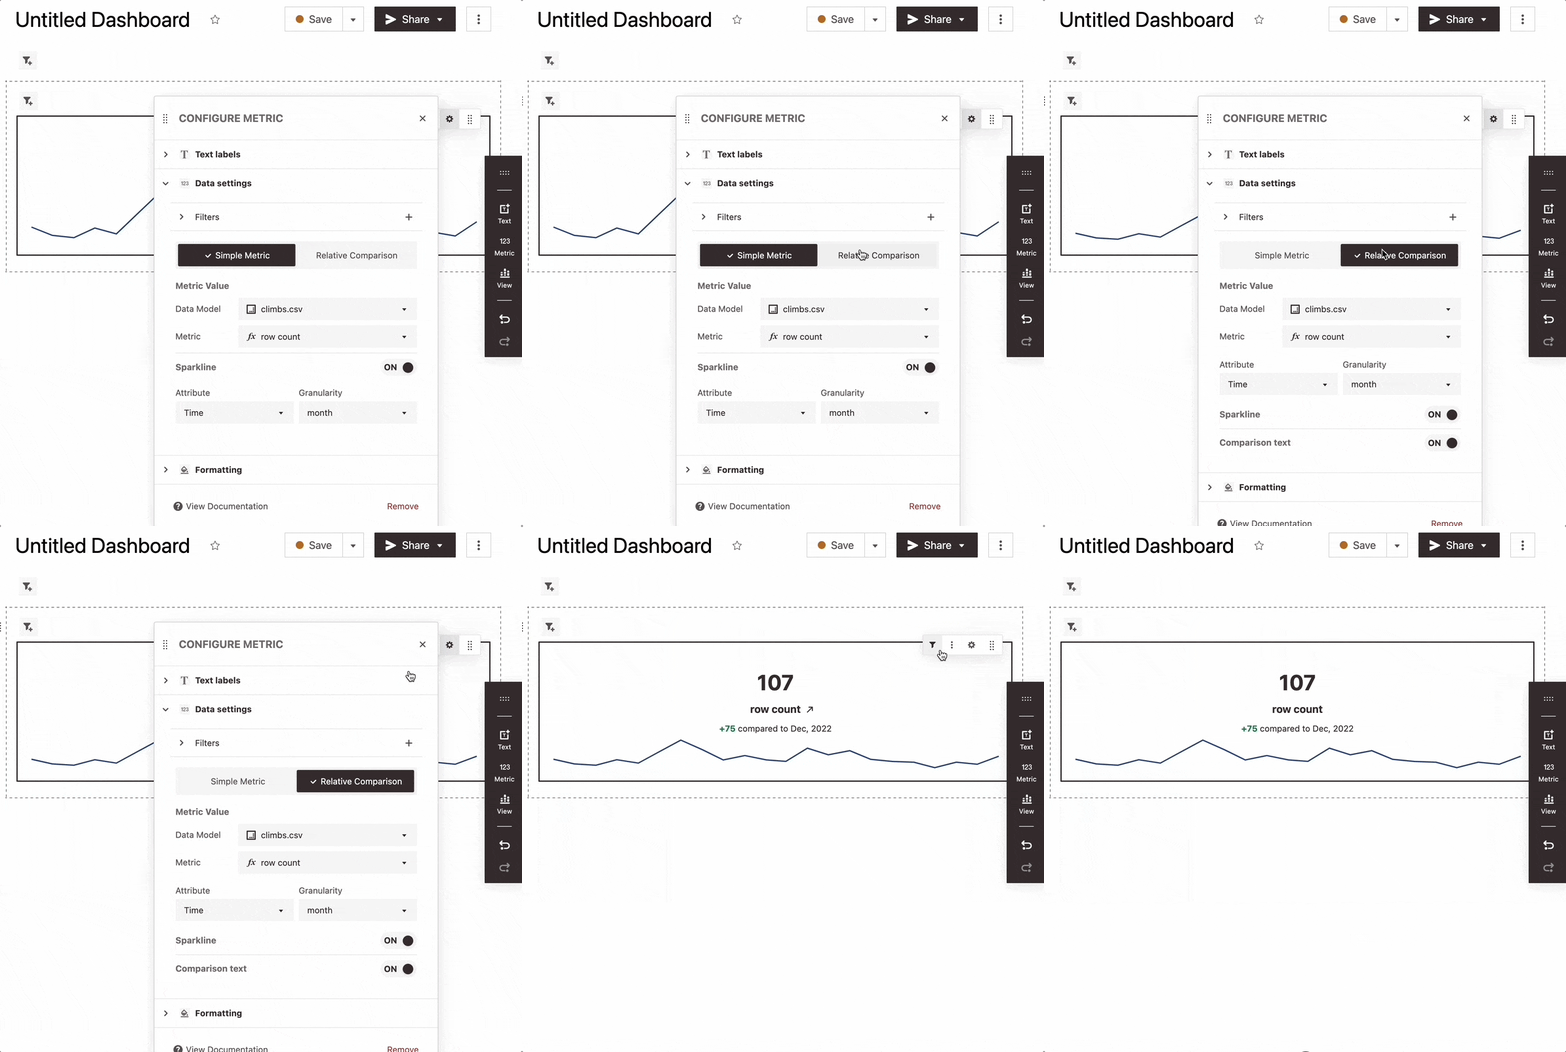
We’ve added several enhancements to our dashboard Metric Tiles! You can now easily monitor key metrics with sparklines and comparisons. Your team can now get a comprehensive sense of how all of your metrics are performing at a glance.
You can also configure tiles to display the latest value instead of the total. For example, you can show yesterday’s user count instead of total user count. Read more in our docs.
Dynamic Breakouts

Breakouts in Glean have always allowed you to pick a set of attributes to track. For example, you can breakout seven customers that are particularly important and track their product usage. Breakouts keep comparison sets manageable and charts looking good. This is a core Glean feature which we love!
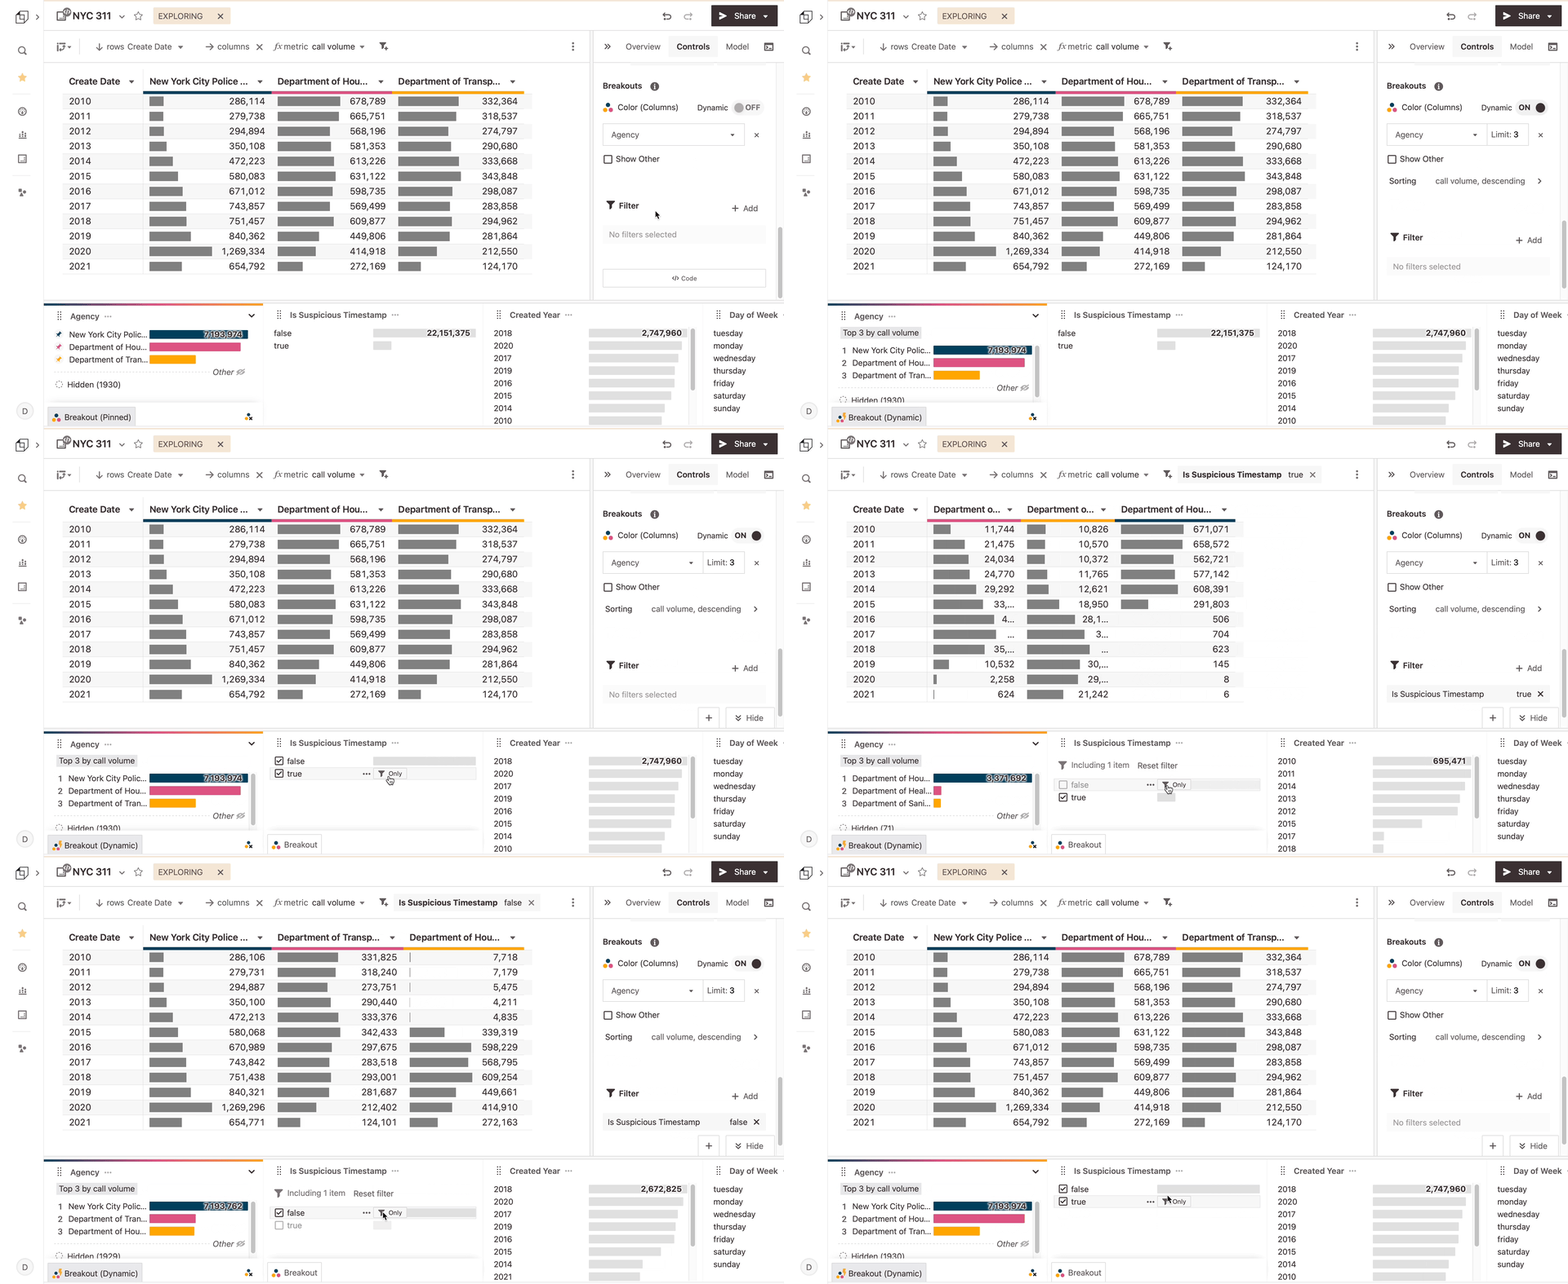
With the addition of ⚡️ Dynamic Breakouts, you can now define criteria that adapts your breakout as your data changes. For example, you could always track the top 20 revenue customers, or you could track the six most recent cohort months.
Dynamic Breakouts allow you to always look at the most relevant data in an easy-to-digest way. Here’s an example in our demo site (opens in a new tab): this retention curve will always look at the three most recent years in the data and group all the other years together.
Deep Search for Metrics with CMD + K
In addition to searching the names of your resources, Glean search (always available with shortcut CMD+K) now surfaces the names of the metrics defined in your data models.
You can jump right into a new exploration with that metric already selected! Resource descriptions are also now searchable, making it easier to find what you're looking for when you can't remember a resource's name.
DataOps Live Recap
Thanks to everyone who joined us last week for a live demo of Glean’s DataOps ! If you missed it, check out the replay and slides here (opens in a new tab).
📣 Let us know what you would like to see next time!
📚 Smaller Product Updates, Blog Posts & More
- ICYMI - Our Slack integration (opens in a new tab) has officially launched! Share saved explorations and dashboards directly to your Slack channels with added notes and context. You can also schedule automated reports and alerts.
- Version Controlling for BI - We know…sometimes version controlling your BI tool is nightmare fuel. Check out the latest (opens in a new tab) on our blog to learn some best practices and major pitfalls to avoid.
- Glean on the Road - Some folks from our team will be at FiveTran's Modern Data Stack (opens in a new tab) Conference next week in SF. If you’ll be there or are based in the Bay Area, let us know - we would love to see you there!
👀 Hoping to see something else on our feature release list? Check out our Product Roadmap (opens in a new tab) and let us know what we’re missing.
You can drop us a note or ping us on Slack with your💡ideas, 🗣 feedback, or 🙋questions. We look forward to👂hearing from you!