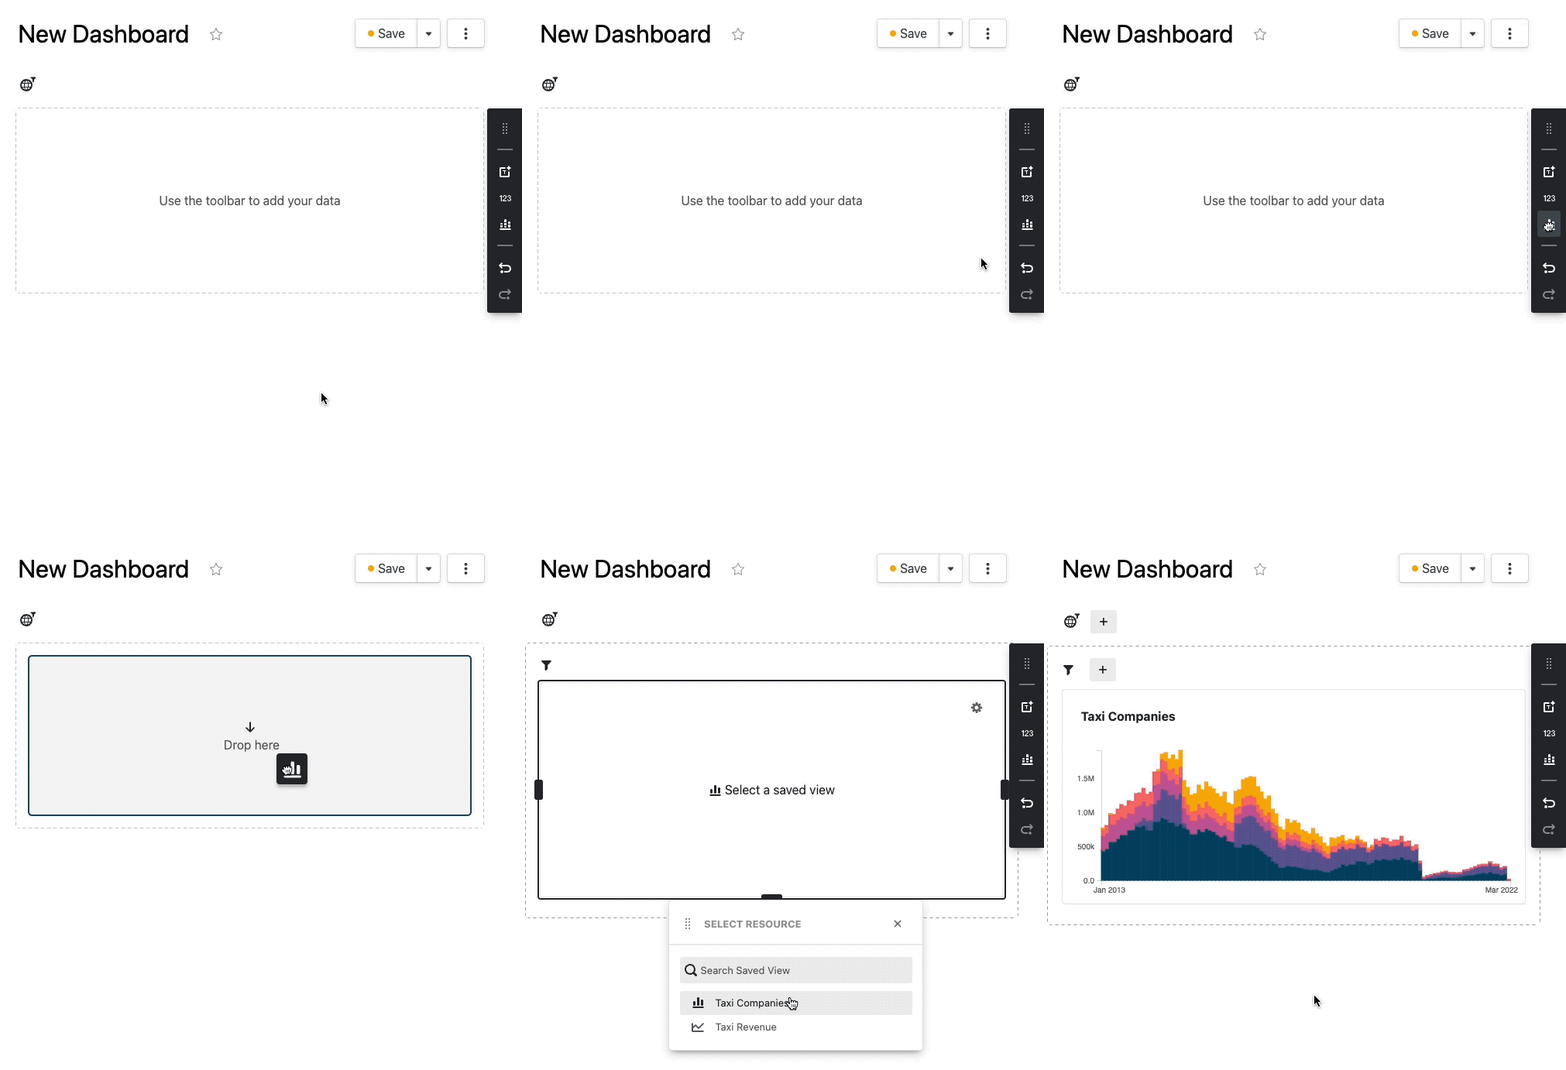
Saved Explorations
Drag the chart icon from the toolbar onto your dashboard, then select any saved exploration to add it to the dashboard.

Configuration
Label
By default, the label of the chart will be the same as the name of the saved exploration. You can override the label when displayed on the dashboard by setting the text here.
Ignore Dashboard Filters
Check this box if you want this saved exploration to ignore dashboard filters. When this is set, only the filters from the saved exploration will be used.
Legend
Change where the legend is placed. You can select Inherit from Saved Exploration to match
legend placement with the saved exploration.
Axis Labels
Change whether the axis of the chart are shown or hidden. You can select "Inherit from Saved Exploration" to match axis label with the saved exploration.
Automatic Color Syncing
If multiple charts on the page define series over the same attribute then the colors will automatically be synchronized. This ensures the colors are consistent between all the charts on the dashboard.