Data Tray
The data tray allows you to view your avaliable data, and configure explorations using it.
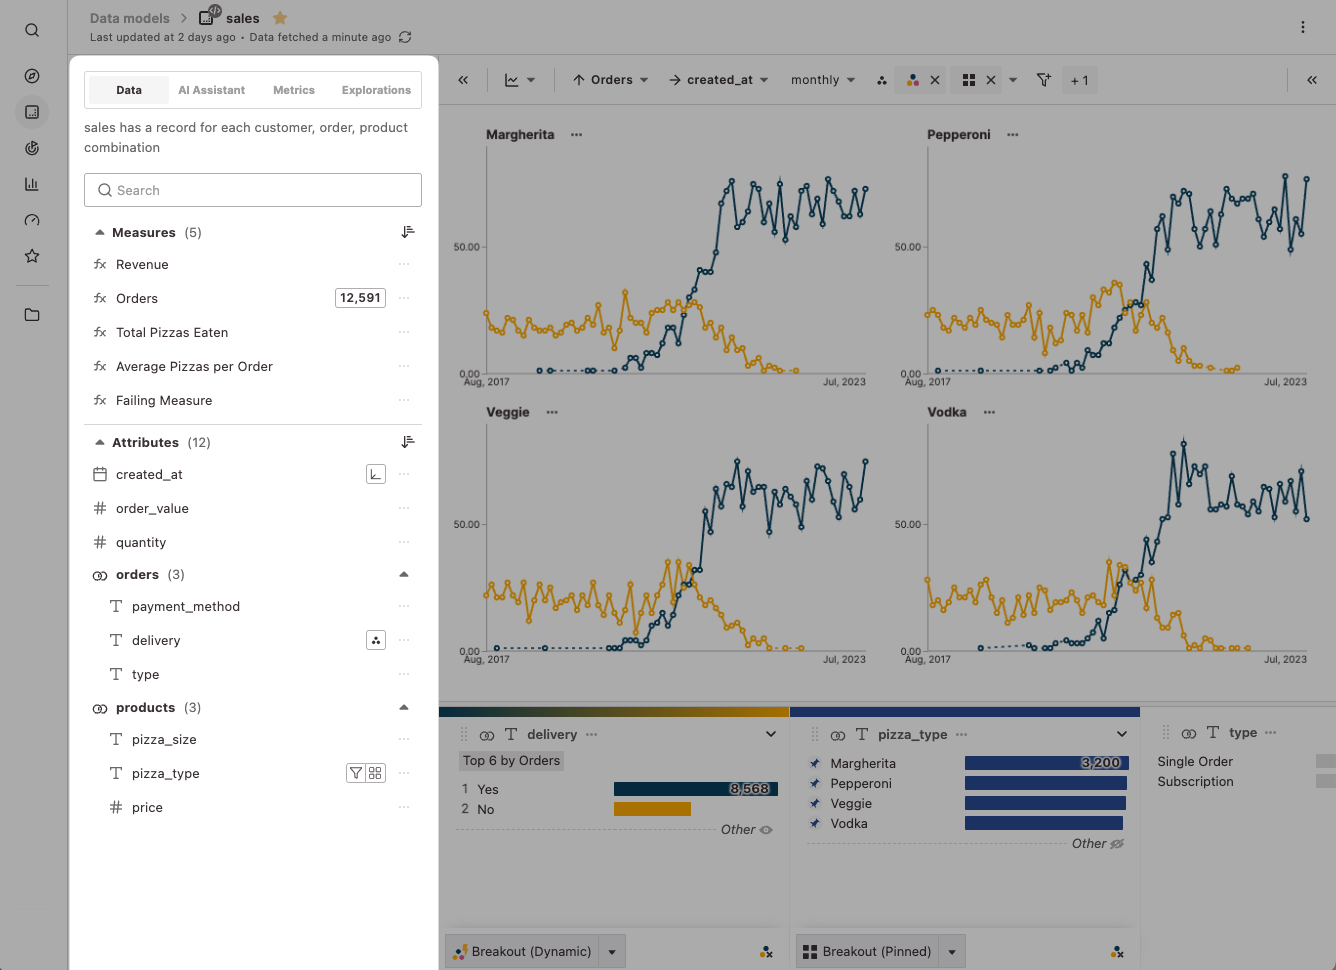
You can open and close it using the left-most button in the chart toolbar, then selecting the "Data" tab.
Measures
In the top section, you will see all available measures for the current model.
Active measures will have a chip containing the value aggregated across all data matching current filters. You can click this chip for more information on how this value is calculated.
Clicking a measure will make it the primary measure for the exploration (for example, making it the y-axis for a bar chart). For more options, click the three dots menu to the right of the measure. Hovering over the name of the measure will show associated documentation for it.
Attributes
In the section below, you will see all available attributes for the current model.
Active attributes will have chips representing how the current exploration is using the attribute. You can click this chip to further configure the associated setting.
Clicking an attribute will show it within the attribute tray. For more options, click the three dots menu to the right of the attribute. Hovering over the name of the attribute will show associated documentation for it.